Terahertz and Infrared Probes
Terahertz and infrared probes measure how a material transmits, reflects, delays, rotates, and absorbs electromagnetic fields whose photon energies overlap many low-energy scales of quantum matter. Depending on frequency and sample, the response can contain mobile-carrier relaxation, superconducting gaps and stiffness, polar phonons, magnons, excitons, intersubband transitions, collective modes, and the onset of interband absorption.
The instrument does not directly record “the optical conductivity” or “the gap.” A Fourier-transform infrared spectrometer usually records detector power as a function of interferometer path difference. A terahertz time-domain spectrometer samples an electric-field waveform versus delay. Turning either record into a material response requires a reference measurement, optical boundary conditions, sample thickness and geometry, polarization calibration, and a causal model or inversion.
A useful evidence ladder is:
- detector record: interferogram, reflected or transmitted power, or sampled electric field versus delay;
- calibrated spectrum: frequency axis, instrument response, reference ratio, phase or polarization channel, and uncertainty;
- optical coefficient: complex transmission, reflection, ellipsometric ratio, or surface impedance for a declared geometry;
- material response: complex conductivity, dielectric function, refractive index, or sheet conductance from a Fresnel or multilayer forward model;
- physical claim: carrier density and relaxation, energy gap, condensate stiffness, polar mode, polariton, or other excitation after alternatives and cross-probe checks.
Each step adds assumptions. A dip in transmission can be an intrinsic absorption, a substrate phonon, an etalon fringe, an aperture effect, or a reference mismatch. Trust begins by preserving those possibilities until the forward model separates them.
Canonical Scope
Section titled “Canonical Scope”This page is the canonical home for terahertz and infrared measurement practice in quantum matter. It owns the relation among field or power records and complex electrodynamic functions; frequency-domain reflectance, transmission, and ellipsometry; field-resolved terahertz time-domain spectroscopy; thin-film and bulk inversion; and probe-specific evidence for Drude response, superconducting gaps and stiffness, polar phonons, and phonon polaritons.
Use Transport, Response, and Optics when the theoretical target has not yet been separated into conductivity, dielectric and loss, coherent, or nonlinear branches.
Drude Theory owns the relaxation-time derivation, Hall tensor, optical spectral weight, extended-Drude diagnostics, and failure modes of the model. Kubo Formula owns the causal current response, contact term, and order of limits. Sum Rules owns exact moment identities. This page uses those objects as outputs of an optical experiment rather than re-deriving them.
BCS Theory owns the pairing spectrum and coherence factors, while London Theory owns local superconducting stiffness and penetration. Phonons owns lattice eigenvectors and longitudinal–transverse mode splitting. Infrared Spectroscopy owns molecular dipole derivatives, rovibrational bands, ordinary FTIR, ATR, and fingerprint-region practice. The focus here is the electrodynamics of extended solids.
Time-domain THz spectroscopy of an equilibrium sample belongs here. An optical-pump–THz-probe experiment prepares a nonequilibrium state and therefore belongs conceptually with Pump–Probe Spectroscopy; this page supplies the equilibrium reference and the field-to-conductivity reduction needed for that analysis.
Spectral Coordinates and Energy Scales
Section titled “Spectral Coordinates and Energy Scales”Frequency labels overlap
Section titled “Frequency labels overlap”Terahertz and infrared are laboratory regions, not distinct fundamental interactions. Boundaries depend on source, detector, community, and sample. One useful orientation is:
| Region | Approximate span | Common quantum-matter content |
|---|---|---|
| microwave and millimetre wave | below roughly | narrow Drude response, resonances, stiffness, vortex dynamics |
| terahertz | roughly to | carrier relaxation, small gaps, magnons, soft modes, low polar phonons |
| far infrared | roughly to | overlaps THz; polar phonons, gaps, collective modes |
| mid infrared | roughly to | lattice and molecular vibrations, mid-infrared bands, low interband absorption |
The overlap is deliberate. A excitation may be described as terahertz, far infrared, , or .
For ordinary frequency , angular frequency , vacuum wavenumber , and wavelength ,
Useful conversions are
The thermal frequency scale is
At , this is about . Thermal occupation can therefore matter strongly for low-frequency modes even when it is negligible in visible spectroscopy.
Momentum and penetration
Section titled “Momentum and penetration”A freely propagating photon transfers little crystal momentum:
Terahertz and infrared far-field experiments usually probe the long-wavelength limit. They can identify zone-center dipole-active modes and uniform current response, but they do not map a full dispersion. Gratings, cavities, waveguides, attenuated-total-reflection geometries, and near-field tips can supply larger in-plane momentum.
Penetration is response dependent. An insulating crystal may transmit through a millimetre, a good metal may be sampled only over a skin depth, and a superconducting field may decay over a penetration depth. “Bulk” and “surface” are therefore frequency-, temperature-, and geometry-dependent statements.
From Optical Fields to Material Response
Section titled “From Optical Fields to Material Response”Convention ledger
Section titled “Convention ledger”Use time dependence and write
is the dissipative conductivity for a passive medium. is the reactive part. With a background dielectric function ,
Thus
For a nonmagnetic isotropic medium, define
The field varies as , so gives attenuation. The intensity absorption coefficient is
These signs change if the Fourier convention changes. A reported without the time convention is incomplete.
In an anisotropic crystal, , , and are tensors. The measured projection depends on crystal axes, propagation direction, polarization, numerical aperture, and any domain average. A scalar inversion can fit an anisotropic sample while assigning the result to no actual tensor component.
Power measurements
Section titled “Power measurements”At normal incidence from vacuum onto an optically thick isotropic half-space,
Reflectance is an intensity ratio and loses the complex reflection phase. Transmission through a finite slab additionally contains entrance and exit Fresnel factors, propagation phase, absorption, and usually internal reflections. For a smooth, nonscattering sample with all output channels collected,
but this bookkeeping fails if diffuse scattering, finite numerical aperture, luminescence, diffraction, or an unmeasured polarization channel carries power away.
Fourier-transform infrared spectroscopy acquires an interferogram and reconstructs a power spectrum. A sample-to-reference ratio can give reflectance or transmittance, but not automatically an intrinsic absorption coefficient. The reference surface, purge, aperture, polarization, beam footprint, detector nonlinearity, and optical throughput must match the sample measurement.
Phase, causality, and model dependence
Section titled “Phase, causality, and model dependence”Real and imaginary response are linked by causality. For a causal susceptibility,
A Kramers–Kronig transform of reflectance can recover phase only with a valid geometry and extrapolations outside the measured band. Conducting, superconducting, insulating, and interband regimes require different low- and high-frequency behavior. A fitted oscillator model can enforce causality, but its components are not unique merely because the total spectrum fits.
Ellipsometry measures the complex polarization ratio
It supplies relative phase information and is powerful for anisotropic or layered samples, but extracting dielectric tensors still requires orientation, roughness, thickness, and multilayer modeling.
Bulk, film, and substrate are different inverse problems
Section titled “Bulk, film, and substrate are different inverse problems”For a bulk slab, thickness uncertainty produces phase uncertainty, and internal reflections produce Fabry–Pérot fringes or delayed echoes. For a thin film on a substrate, the measured field traverses a coupled air–film–substrate stack. The natural low-frequency film observable is often the sheet conductance
where is film thickness.
In the thin-film limit, at normal incidence, for a film on a nonabsorbing substrate of index , and after division by a matched bare-substrate reference,
Here is the vacuum impedance. This useful formula assumes that the film is electromagnetically thin, the film and reference substrates are optically matched, and unresolved multiple reflections can be neglected or removed consistently. Outside those conditions, use the full transfer matrix.
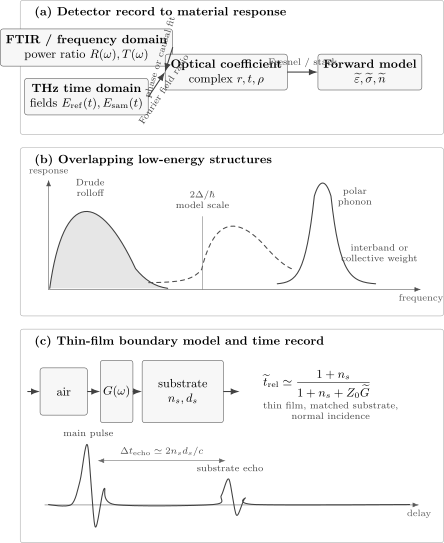
The measurement workflow. Power spectra require phase recovery or a causal forward model, while THz time-domain sampling retains field amplitude and phase. Free carriers, superconducting redistribution, and polar modes can overlap in frequency. A thin film is naturally reduced to sheet conductance only under declared boundary and thickness assumptions.
Low-Energy Electrodynamics
Section titled “Low-Energy Electrodynamics”Drude response as a hypothesis
Section titled “Drude response as a hypothesis”For one isotropic relaxation channel,
The full derivation and parameter meanings belong to Drude Theory. Experimentally, the key signatures are:
- approaches a finite dc value and rolls over near ;
- for the one-component model;
- the integrated intraband weight is tied to ;
- the same parameters should be compatible with dc transport over the appropriate limit.
A narrow Drude peak can lie partly below the measured band. Fitting only its high-frequency tail makes and strongly correlated. Conversely, a broad background can be an additional band, incoherent response, localization, a phonon tail, or an interband process. One Drude term is a model choice, not a definition of metallicity.
For several carrier channels,
The decomposition may be nonunique over a limited band. Temperature, field, doping, polarization, Hall data, and a wider spectral range can break parameter degeneracies.
Spectral weight and correlation
Section titled “Spectral weight and correlation”Define a partial optical weight
Changing temperature or phase can move weight between a narrow Drude peak, a mid-infrared band, interband transitions, and a zero-frequency condensate. A partial weight depends on cutoff. Calling its variation a violation of a sum rule is unjustified unless omitted tails, tensor direction, units, and the corresponding exact operator identity are controlled.
An extended-Drude inversion can define frequency-dependent optical scattering and mass functions. These are compact representations of a complex response after choosing a plasma frequency. They are not uniquely measured microscopic self-energies, especially in multiband systems or where interband absorption overlaps the intraband response.
Gaps and thresholds outside superconductors
Section titled “Gaps and thresholds outside superconductors”A suppression of may indicate a band gap, density-wave gap, hybridization gap, localization scale, Coulomb gap, or superconducting gap. The threshold need not equal twice a single-particle gap:
- matrix elements can suppress the onset;
- indirect transitions need momentum assistance;
- excitons can appear below a continuum;
- disorder produces tails;
- coherence factors reshape thresholds;
- collective modes can lie inside a gap;
- a finite experimental floor can mimic zero absorption.
Optical conductivity is a two-particle current response. Compare it with tunneling or photoemission rather than treating all three as identical densities of states.
Superconducting Gap and Stiffness
Section titled “Superconducting Gap and Stiffness”What an ideal threshold means
Section titled “What an ideal threshold means”In a local, isotropic, weak-coupling -wave superconductor, a photon with negligible momentum can create two quasiparticles once
at low temperature. The Mattis–Bardeen dirty-limit response gives a sharp model for how and evolve across that scale. More general calculations include arbitrary purity, strong coupling, anisotropy, several bands, pair breaking, and nonlocality.
The threshold is kinematic; its optical weight depends on the current vertex, band structure, and momentum-relaxing processes. In a perfectly clean, translationally invariant single-band limit, regular absorption at negligible photon momentum can be strongly suppressed. The phrase “optical gap equals ” is therefore conditional. A nodal superconductor has low-energy quasiparticles rather than a hard threshold. Thermal quasiparticles create subgap absorption. Disorder can broaden or fill the gap, and a multiband material can display several weighted onsets. Phonons, substrate resonances, and Fabry–Pérot structure can overlap the same frequency range.
Reactive response and condensate weight
Section titled “Reactive response and condensate weight”At low frequency, an ideal local superconducting contribution has
is the electromagnetic stiffness in this convention and is the local penetration depth. A rise in is stronger evidence for coherent inductive response than a transmission increase alone, but regular quasiparticle and dielectric terms must be subtracted.
The finite-frequency weight lost from enters the zero-frequency condensate. With a positive-frequency convention,
provided is high enough for the normal and superconducting weights to converge and the normal reference is valid. This is the operational Ferrell–Glover–Tinkham test. If the integral has not converged, the inferred stiffness remains cutoff dependent.
A defensible superconducting inference
Section titled “A defensible superconducting inference”Evidence should include:
- complex or surface impedance, not only one transmission curve;
- a documented normal-state reference and temperature calibration;
- a low-frequency consistent with stiffness and penetration measurements;
- missing-area recovery within uncertainty;
- a gap model appropriate to cleanliness, symmetry, band count, and scattering;
- substrate, thickness, etalon, and phonon controls;
- bulk superconductivity from magnetic or thermodynamic evidence.
An optical threshold constrains an electrodynamic excitation scale. It does not alone determine pairing symmetry or establish a bulk superconducting phase.
Polar Phonons and Polaritons
Section titled “Polar Phonons and Polaritons”Infrared-active crystal modes
Section titled “Infrared-active crystal modes”An infrared-active zone-center phonon carries a nonzero mode effective charge. Its coherent ionic displacement produces macroscopic polarization and couples to the electric field. A convenient dielectric model is
is a transverse optical frequency in the model, is damping, and is dielectric strength. Coupled or low-symmetry modes may require factorized, tensor, or nonlocal forms; a sum of independent Lorentzians is not universal.
Transverse optical modes appear near poles of the transverse dielectric response. Longitudinal modes are associated with zeros of the relevant longitudinal dielectric function. For one ideal isotropic polar mode,
This Lyddane–Sachs–Teller relation generalizes for several modes and anisotropic crystals, where tensor determinants and mode mixing matter.
Between an ideal TO pole and LO zero, can be negative and bulk propagation is strongly suppressed. The resulting high-reflectance interval is a Reststrahlen band. A Raman-active mode need not be infrared active: Raman coupling requires a polarizability derivative, while infrared coupling requires a dipole or mode-effective-charge channel.
Bulk and surface phonon polaritons
Section titled “Bulk and surface phonon polaritons”A transverse electromagnetic wave coupled to a polar optical phonon obeys, in an isotropic local medium,
The mixed eigenmodes are phonon polaritons. Their photon-like and phonon-like character varies along the dispersion. A far-field spectrum at small samples only a narrow part of that dispersion.
At a planar interface with a dielectric of permittivity , an electrostatic surface phonon-polariton condition is approximately
The exact retarded dispersion includes both dielectric functions and the in-plane momentum. Near-field tips, prisms, gratings, resonators, or patterned structures provide the momentum needed to launch confined modes.
In anisotropic crystals, principal dielectric components can have opposite signs within a Reststrahlen band. The resulting hyperbolic phonon polaritons have strongly directional, high-momentum propagation. Assigning such a mode requires the dielectric tensor and boundary geometry, not just a reflectance peak.
Soft modes and phase transitions
Section titled “Soft modes and phase transitions”A polar mode that softens can strongly enhance the static dielectric response. Frequency, damping, oscillator strength, central relaxation, domains, and conductivity should be fitted together. A low-frequency dielectric anomaly can come from electrodes, defects, domain walls, Maxwell–Wagner polarization, or mobile carriers rather than an intrinsic soft phonon.
Cross-check infrared mode symmetry with diffraction, Raman spectroscopy, isotope or pressure evolution, and calculated Born effective charges. A peak position alone rarely determines the atomic displacement pattern.
Time-Domain THz Spectroscopy
Section titled “Time-Domain THz Spectroscopy”Sampling the electric field
Section titled “Sampling the electric field”A common THz time-domain spectrometer uses an ultrashort optical pulse to generate a broadband THz transient by a photoconductive antenna, optical rectification, or another coherent source. A synchronized gate samples the transmitted or reflected THz field with a photoconductive receiver or electro-optic crystal. Scanning delay produces
Fourier transformation gives complex spectral fields:
The measured transfer function is
Because the waveform is coherently sampled, both amplitude and phase survive. This often permits direct recovery of complex refractive index or conductivity over the usable bandwidth without a reflectance-only phase transform. It does not remove the need for a boundary model.
Thin-film inversion
Section titled “Thin-film inversion”For the thin-film expression above,
Dividing by an independently measured thickness gives bulk conductivity. If the active layer is atomically thin or thickness is ill-defined, sheet conductance is the less assumption-heavy result.
The simple inversion fails when:
- the film is not electromagnetically thin;
- substrate and reference thicknesses differ enough to create a phase ramp;
- substrate absorption or dispersion is neglected;
- internal reflections overlap the main pulse;
- the beam samples different apertures or positions;
- the film is laterally inhomogeneous or anisotropic;
- magnetic permeability or spatial dispersion matters.
A transfer-matrix fit to the complex field is preferable when several layers or echoes contribute.
Time window, bandwidth, and dynamic range
Section titled “Time window, bandwidth, and dynamic range”For a sampled window of duration , the natural Fourier grid is of order
Zero padding makes a smoother plotted curve but does not create finer physical resolution. Truncating the trace before a substrate echo shortens the usable window and broadens sharp features. Keeping the echo requires modeling its multiple-reflection physics.
The high-frequency limit is set by generation, detection, optics, sampling interval, and signal-to-noise. The low-frequency limit is affected by finite window, beam diffraction, apertures, and drift. Near frequencies where the reference field is small, division amplifies noise and can produce convincing but meaningless structure.
For a substrate of thickness and refractive index , the round-trip echo delay is approximately
This time-domain separation is a strength of THz spectroscopy, but only if pulse duration, absorption, and window length permit distinct echoes.
Phase errors are material errors
Section titled “Phase errors are material errors”A sample–reference displacement produces an approximate phase error
for a simple free-space offset. The resulting linear phase ramp biases refractive index and . Thickness uncertainty has a similar effect. Repeat insertion, fixed mounts, independent profilometry, and joint uncertainty propagation are therefore central, not administrative.
Atmospheric water has sharp rotational absorption throughout much of the THz band. Purge or vacuum, matched acquisition times, and inspection of known gas lines are standard controls. Numerical removal cannot recover information at a frequency where the sample signal has fallen below the noise floor.
Equilibrium versus driven response
Section titled “Equilibrium versus driven response”Ordinary THz-TDS characterizes a stationary sample with a weak probe. In optical-pump–THz-probe spectroscopy, a pump changes the state and the measured quantity depends on pump–probe delay. Converting the differential field to a transient conductivity requires the excitation-depth profile, pump and probe penetration mismatch, nonstationarity during the THz waveform, and a multilayer nonequilibrium model.
Strong-field THz pulses can also drive nonlinear current, phonon, magnon, Josephson, or order-parameter dynamics. Once the response depends on field amplitude or waveform, a linear is no longer a complete description.
Experimental Workflow
Section titled “Experimental Workflow”Before acquisition
Section titled “Before acquisition”- Name the target response. Decide whether the claim requires sheet conductance, bulk conductivity, dielectric tensor, surface impedance, or only a calibrated optical coefficient.
- Choose the frequency and temperature window. Include both sides of the expected relaxation, gap, or mode when possible.
- Characterize the sample. Record thickness, roughness, area, crystallographic orientation, substrate, interfaces, contacts, and environment.
- Write the forward stack. List every layer, index, thickness, polarization, incidence angle, and internal reflection retained in the model.
- Plan references and controls. Use a matched substrate, mirror, open aperture, normal state, field-suppressed state, or empty cryostat as appropriate.
During acquisition
Section titled “During acquisition”- monitor source power or field, detector linearity, purge, temperature, and drift;
- repeat sample and reference scans in an interleaved order;
- measure both polarization axes where anisotropy is possible;
- vary aperture, spot position, and sample orientation to expose diffraction or inhomogeneity;
- retain raw interferograms or time traces and acquisition metadata;
- measure thickness and substrate dispersion independently where feasible.
During reduction
Section titled “During reduction”- transform sample and reference with identical windows and phase conventions;
- mask frequencies below a declared dynamic-range threshold;
- fit complex amplitude and phase together;
- include substrate dispersion, echoes, roughness, and finite thickness at the level required by the claim;
- propagate reference, thickness, alignment, baseline, and model uncertainty;
- enforce causality and test sum-rule convergence over a wider band;
- compare with dc, microwave, Raman, tunneling, thermodynamic, or scattering data.
Observable and Claim Ledger
Section titled “Observable and Claim Ledger”| Observed feature | Immediate inference | Additional requirement |
|---|---|---|
| low-frequency rolloff and dispersive | finite current-relaxation scale | dc consistency and multichannel tests |
| increased subgap transmission below | reduced dissipation in that band | complex conductivity, stiffness, and bulk superconductivity |
| contribution to | inductive spectral weight | regular-background subtraction and missing-area closure |
| absorption onset | allowed optical excitation scale | matrix element, disorder, and indirect-process model |
| Lorentz-like polar mode | dipole-active resonance | symmetry, tensor direction, and substrate separation |
| high reflectance between TO and LO scales | negative dielectric interval | causal dielectric fit and mode assignment |
| delayed pulse replica | internal optical path | thickness and index consistency |
| narrow atmospheric lines | gas-path mismatch | purge or matched reference, not a material fit |
Common Mistakes
Section titled “Common Mistakes”- Treating THz and infrared as sharply separated physical regimes.
- Calling transmittance, absorbance, loss function, , and interchangeable.
- Reporting without the Fourier-sign convention.
- Applying a half-space Fresnel formula to a thin film on a substrate.
- Dividing by film thickness when sheet conductance is the actually constrained quantity.
- Ignoring a substrate thickness mismatch because the power spectra look similar.
- Fitting only amplitude when phase is measured.
- Assuming a reflectance Kramers–Kronig inversion is independent of extrapolation.
- Calling every low-frequency peak a phonon or every suppression a gap.
- Equating an optical gap threshold with a unique single-particle gap.
- Using a one-component Drude fit without testing dc and wider-band consistency.
- Interpreting a fitted extended-Drude scattering rate as a unique self-energy.
- Identifying superconductivity from reduced absorption without stiffness or bulk evidence.
- Reading a surface polariton directly from a far-field peak without a momentum-coupling model.
- Zero-padding a short waveform and claiming improved resolution.
- Removing water lines numerically where the underlying sample field is below noise.
- Time-gating an echo without reporting the resulting spectral broadening.
- Treating an optical-pump–THz-probe differential spectrum as an equilibrium conductivity.
Exercises
Section titled “Exercises”1. Convert a terahertz scale
Section titled “1. Convert a terahertz scale”Convert to meV, reciprocal centimetres, and vacuum wavelength.
Solution
Using the conversion ledger,
This lies in the overlap commonly called terahertz and far infrared.
2. Invert a thin-film transmission
Section titled “2. Invert a thin-film transmission”A film lies on a substrate with . At one frequency the complex film-plus-substrate transmission relative to a matched bare substrate is
Use the thin-film expression to estimate sheet conductance and bulk conductivity.
Solution
First,
Therefore
With ,
The result inherits the thin-film, matched-substrate, normal-incidence, and time-convention assumptions.
3. Read a Drude point
Section titled “3. Read a Drude point”A one-component Drude response has and . Find , , and their ratio at .
Solution
The dimensionless frequency is
For
one has
A measured ratio inconsistent with this value would reject the one-component parameter set even if one component alone looked plausible.
4. Infer a penetration depth
Section titled “4. Infer a penetration depth”After subtracting regular dielectric and quasiparticle terms, a superconductor has at . Assuming , estimate .
Solution
The stiffness is
Then
If regular terms were not removed, this procedure would misassign their reactive weight to the condensate.
5. Locate a polariton frequency
Section titled “5. Locate a polariton frequency”An ideal one-mode polar dielectric has the factorized response
where all frequencies are in THz, the TO pole is at , and the LO zero is at . Determine , identify the negative-permittivity interval, and solve the vacuum-interface surface condition .
Solution
At zero frequency,
For , the denominator is negative while the numerator is positive, so . This is the ideal Reststrahlen interval.
At a vacuum interface,
so
It lies between the TO pole and LO zero.
6. Echoes and resolution
Section titled “6. Echoes and resolution”A substrate is thick with . Estimate its round-trip echo delay. Compare the Fourier-grid scales for a trace gated just before the echo and for an trace in which echoes are modeled.
Solution
The echo delay is
A pre-echo gate has a frequency scale no finer than roughly
An modeled trace has
The longer trace can resolve narrower structure only if the echo model, timing stability, and dynamic range are trustworthy.
7. Audit a superconducting-gap claim
Section titled “7. Audit a superconducting-gap claim”Below a resistive transition, a thin film transmits more strongly below . A report identifies from this observation alone. What is missing?
Solution
The transmission increase establishes reduced net attenuation in that sample–substrate stack. It does not yet isolate a superconducting pair-breaking threshold. A defensible analysis should add:
- complex field or phase-sensitive data and a multilayer inversion to and ;
- thickness, substrate, temperature, and reference uncertainties;
- tests for phonons, etalons, apertures, and normal-state carrier narrowing;
- a inductive response and missing-area consistency;
- magnetic or thermodynamic confirmation of bulk superconductivity;
- a Mattis–Bardeen or more appropriate gap model, including temperature, disorder, anisotropy, and multiple bands;
- enough bandwidth to show both sides of the proposed onset.
The original observation is compatible with a gap, but it does not determine one uniquely.
Research Status
Section titled “Research Status”- Established: causal optical response, Fresnel and multilayer electrodynamics, Drude and Lorentz models in their stated domains, infrared-active phonons, Lyddane–Sachs–Teller relations, superconducting missing-area transfer, coherent THz field sampling, and transfer-matrix reduction.
- Model dependent: multicomponent Drude decompositions, extended-Drude self-energy language, gap extraction in anisotropic or multiband materials, oscillator decomposition of overlapping modes, effective-medium fits, and substrate-corrected thin-film conductivity.
- Active: nonlinear and multidimensional THz spectroscopy, extreme-condition THz access, nanoscale and on-chip THz probes, cavity-modified quantum matter, hyperbolic and nonlocal phonon polaritons, and uncertainty-aware inversion of heterogeneous multilayers.
- Unsupported without controls: assigning a new gap, condensate, exotic collective mode, or polariton from one intensity feature without complex response, boundary modeling, and complementary evidence.
Cross-Links
Section titled “Cross-Links”- How Quantum Matter Is Measured gives the general detector-to-response-to-claim contract.
- Drude Theory derives the free-carrier response and its responsible fitting limits.
- Kubo Formula derives causal electrical conductivity and the required contact term.
- Sum Rules owns exact spectral moments and cutoff audits.
- BCS Theory develops the quasiparticle gap and pairing evidence.
- London Theory owns electromagnetic stiffness and penetration depth.
- Superconducting Proximity Effect predicts layer-dependent gaps, stiffness transfer, and inverse suppression in superconducting multilayers; this page retains the Fresnel or transfer-matrix inversion, substrate, thickness, bandwidth, and background ledger.
- Vortex Matter, Pinning, and Flux Flow owns the pinning, creep, and driven-vortex interpretation of microwave and low-frequency mixed-state response; this page retains field-to-conductivity reduction, multilayer optics, backgrounds, and bandwidth limits.
- Phonons develops lattice eigenvectors, mode charges, and LO–TO splitting.
- Raman and Optical Spectroscopy gives complementary polarizability and symmetry channels.
- Infrared Spectroscopy owns molecular vibrational, FTIR, and ATR practice.
- Transport Measurements provides the dc and tensor limits against which optical transport is checked.
References
Section titled “References”- M. Dressel and G. Grüner, Electrodynamics of Solids: Optical Properties of Electrons in Matter (Cambridge University Press, 2002), doi:10.1017/CBO9780511606168.
- F. Wooten, Optical Properties of Solids (Academic Press, 1972).
- D. N. Basov, R. D. Averitt, D. van der Marel, M. Dressel, and K. Haule, “Electrodynamics of Correlated Electron Materials,” Reviews of Modern Physics 83, 471–541 (2011), doi:10.1103/RevModPhys.83.471.
- A. B. Kuzmenko, “Kramers–Kronig Constrained Variational Analysis of Optical Spectra,” Review of Scientific Instruments 76, 083108 (2005), doi:10.1063/1.1979470.
- R. E. Glover III and M. Tinkham, “Conductivity of Superconducting Films for Photon Energies between and ,” Physical Review 108, 243–256 (1957), doi:10.1103/PhysRev.108.243.
- R. A. Ferrell and R. E. Glover III, “Conductivity of Superconducting Films: A Sum Rule,” Physical Review 109, 1398–1399 (1958), doi:10.1103/PhysRev.109.1398.
- M. Tinkham and R. A. Ferrell, “Determination of the Superconducting Skin Depth from the Energy Gap and Sum Rule,” Physical Review Letters 2, 331–333 (1959), doi:10.1103/PhysRevLett.2.331.
- D. C. Mattis and J. Bardeen, “Theory of the Anomalous Skin Effect in Normal and Superconducting Metals,” Physical Review 111, 412–417 (1958), doi:10.1103/PhysRev.111.412.
- W. Zimmermann, E. H. Brandt, M. Bauer, E. Seider, and L. Genzel, “Optical Conductivity of BCS Superconductors with Arbitrary Purity,” Physica C 183, 99–104 (1991), doi:10.1016/0921-4534(91)90771-P.
- R. H. Lyddane, R. G. Sachs, and E. Teller, “On the Polar Vibrations of Alkali Halides,” Physical Review 59, 673–676 (1941), doi:10.1103/PhysRev.59.673.
- K. Huang, “On the Interaction between the Radiation Field and Ionic Crystals,” Proceedings of the Royal Society A 208, 352–365 (1951), doi:10.1098/rspa.1951.0166.
- J. D. Caldwell et al., “Low-Loss, Infrared and Terahertz Nanophotonics Using Surface Phonon Polaritons,” Nanophotonics 4, 44–68 (2015), doi:10.1515/nanoph-2014-0003.
- D. N. Basov, M. M. Fogler, and F. J. García de Abajo, “Polaritons in van der Waals Materials,” Science 354, aag1992 (2016), doi:10.1126/science.aag1992.
- D. H. Auston, K. P. Cheung, J. A. Valdmanis, and D. A. Kleinman, “Cherenkov Radiation from Femtosecond Optical Pulses in Electro-Optic Media,” Physical Review Letters 53, 1555–1558 (1984), doi:10.1103/PhysRevLett.53.1555.
- D. Grischkowsky, S. Keiding, M. van Exter, and C. Fattinger, “Far-Infrared Time-Domain Spectroscopy with Terahertz Beams of Dielectrics and Semiconductors,” Journal of the Optical Society of America B 7, 2006–2015 (1990), doi:10.1364/JOSAB.7.002006.
- Q. Wu and X.-C. Zhang, “Free-Space Electro-Optic Sampling of Terahertz Beams,” Applied Physics Letters 67, 3523–3525 (1995), doi:10.1063/1.114909.
- P. U. Jepsen, D. G. Cooke, and M. Koch, “Terahertz Spectroscopy and Imaging: Modern Techniques and Applications,” Laser & Photonics Reviews 5, 124–166 (2011), doi:10.1002/lpor.201000011.
- W. Withayachumnankul, B. M. Fischer, H. Lin, and D. Abbott, “Uncertainty in Terahertz Time-Domain Spectroscopy Measurement,” Journal of the Optical Society of America B 25, 1059–1072 (2008), doi:10.1364/JOSAB.25.001059.
- M. van Exter, C. Fattinger, and D. Grischkowsky, “Terahertz Time-Domain Spectroscopy of Water Vapor,” Optics Letters 14, 1128–1130 (1989), doi:10.1364/OL.14.001128.
- Joint Committee for Guides in Metrology, Evaluation of Measurement Data: Guide to the Expression of Uncertainty in Measurement, JCGM 100:2008.